

Abstract
Oil and gas production is one of the largest emitters of methane, a potent greenhouse gas and a significant contributor of air pollution emissions. While research on methane emissions from oil and gas production has grown rapidly, there is comparatively limited information on the distribution of impacts of this sector on air quality and associated health impacts. Understanding the contribution of air quality and health impacts of oil and gas can be useful for designing mitigation strategies. Here we assess air quality and human health impacts associated with ozone, fine particulate matter, and nitrogen dioxide from the oil and gas sector in the US in 2016, and compare this impact with that of the associated methane emissions. We find that air pollution in 2016 from the oil and gas sector in the US resulted in 410 000 asthma exacerbations, 2200 new cases of childhood asthma and 7500 excess deaths, with $77 billion in total health impacts. NO2 was the highest contributor to health impacts (37%) followed by ozone (35%), and then PM2.5 (28%). When monetized, these air quality health impacts of oil and gas production exceeded estimated climate impact costs from methane leakage by a factor of 3. These impacts add to the total life cycle impacts of oil and gas, and represent potential additional health benefits of strategies that reduce consumption of oil and gas. Policies to reduce oil and gas production emissions will lead to additional and significant health benefits from co-pollutant reductions that are not currently quantified or monetized.
Export citation and abstract BibTeX RIS

Original content from this work may be used under the terms of the Creative Commons Attribution 4.0 license. Any further distribution of this work must maintain attribution to the author(s) and the title of the work, journal citation and DOI.
1. Introduction
The U.S. Environmental Protection Agency (U.S. EPA) estimates indicate that natural gas and petroleum production and transportation systems are the second largest emitters of methane—emitting 7.05 million metric tons in 2018 [1–6]. Research on 2015 emissions indicates this may be underestimated by ∼60% [1]. Many non-methane volatile organic compounds (NMVOCs) are emitted alongside methane [7], contributing to the oil and gas (O&G) sector being the second largest anthropogenic source of volatile organic compounds (VOCs) in the U.S [8]. Also, many O&G production processes involve fuel combustion resulting in emissions of nitrogen oxides (NOx ), sulfur dioxide (SO2), ammonia (NH3), and fine particulate matter (PM2.5) [7], all of which contribute to air pollution and health impacts [9, 10]. PM2.5, ozone, and NO2 are of concern from a regional air pollution and health standpoint, since they are associated with increased risk of premature death, respiratory and cardiovascular hospitalizations, heart attack, asthma, birth outcomes, among other health impacts [11–14].
While methane emissions across the life cycle of oil and gas have been a topic of a large body of previous research [1, 4, 15–21], comparatively few studies have focused on fully quantifying the health and air pollution impacts of oil & gas production in the U.S [22, 23]. These health costs could be an important component of the full life cycle costs of oil and gas, and an important consideration in the design of policies around emissions from O&G production. Methane emissions from O&G are a major climate policy concern [1, 24], and many policies that affect the emissions of methane from O&G production may also affect emissions of air pollutants and consequent health impacts [22, 25]. Therefore, understanding the health impacts of air pollution from O&G production is important from a climate 'co-benefits' perspective, a public health perspective, and an environmental justice perspective [26–30]. Observational studies indicate that populations living in proximity to or downwind of oil and gas activity have higher rates of poor birth outcomes [31], asthma exacerbations [32], emergency room visits [33], hospitalizations [34], cardiovascular disease [35] and other adverse health outcomes [36]. Air pollution from oil and gas activity is often hypothesized to be one of the causative agents contributing to these adverse health effects, but there is limited knowledge on the direct burden of disease attributed to regional oil and gas air pollution, which has implications for oil and gas policy and air quality management. Previous O&G air quality health impact assessments have not used atmospheric models with detailed ozone or chemistry on how VOC emissions affect PM2.5 formation, updated epidemiology on increased mortality risk and exposure to ozone or NO2, or assessed impacts on children, notably asthma [22, 37]. Thus, they likely do not capture the full extent of oil and gas impacts on criteria air pollutants and associated adverse health effects, which is important to understand the full life cycle impacts of oil and gas.
Here, we assess the current air quality and health impacts from the sector in the U.S in 2016, using a novel framework that accepts geospatially resolved emissions data and simulates the consequent air pollution, with advanced representation of gas-phase chemistry as well as comprehensive aerosol treatment with aqueous chemistry, that is relevant to assessing PM2.5, NO2 and ozone impacts. This air pollution model output is then linked to a geospatial air pollution health impact assessment platform to assess and compare the magnitude and distribution of the health impacts of air pollution from oil and gas production activities to better quantify the public health burden and health damages associated with air pollution from oil and gas production so it can be added to climate damage estimates.
2. Methods
2.1. Model framework
To assess the current health impacts of criteria air pollutants and precursor emissions from O&G production, we used an integrated geospatial model framework that links emissions inventories from O&G production to changes in air quality and health in exposed populations. O&G production emissions are based on the National Emission Inventory (NEI 2016) from the U.S. EPA [38]. These emissions estimates are linked to the Community Multiscale Air Quality model version 5.2.1 (CMAQ v5.2.1), an air pollution chemistry and transport model which simulates how these emissions affect air pollution throughout the Continental United States on a 12 km × 12 km grid [9, 39–41]. The resulting changes in air pollution are then run through BenMAPR (a geospatial health impact assessment model in R, based on the Benefits Mapping and Analysis Program (BenMAP) from the U.S. EPA [42, 43]). BenMAPR links geospatial data on air pollution concentrations with geospatial data on population and age structure at the U.S. Census tract level [44], background disease rates at county level [45], and a series of concentration response functions (CRFs) mathematically describing the relationship between increased air pollution exposure and increased risk of disease [11–13, 46–53], to assess the health impacts or benefits under different air pollution emissions scenarios. We then used this model framework to assess the impacts of air pollution and health impacts from O&G production in 2016. Additionally, we develop a metric for health impact and climate impact from non-methane greenhouse gases (GHGs) to compare the impacts of methane to climate and health impacts from non-methane sources. Each model component is described below.
2.2. Emissions inventory development
We used the U.S. EPA's NEI Collaborative 2016v1 emissions modeling platform for our base year of 2016 [54]. Emission inventories were processed with the Sparse Matrix Operating Kernel Emissions modeling system version 4.6 [55] to create spatio-temporally and chemically resolved emissions in a format that can be input into the air quality model. There are two types of emissions sectors, namely non-point (np_oilgas) and point (pt_oilgas), in the full suite of oil and natural gas emissions represented in the NEI [38]. While the pt_oilgas portion has explicit latitude/longitude coordinates for individual sources in this sector, the np_oilgas includes sources that are relatively too small to be tracked individually, and hence aggregated and reported at the county resolution. The combined np_oilgas and pt_oilgas sectors consist of oil and natural gas upstream exploration, development, production, drilling rigs, compressor, flares, venting, processing plants, storage, pipeline-transportation, and service stations. The emissions covered include PM2.5, NOx , VOCs, NH3, and SO2. Further details on oil and natural gas emissions preparation can be found at the U.S. EPA's National Emissions Inventory Collaborative website [38].
2.3. Air pollution modeling
We used the CMAQ v5.2.1 [9, 56] to simulate air quality (PM2.5, NO2, and O3) over the continental U.S. for 2016 at a spatial resolution of 12 km × 12 km with 35 vertical layers. The meteorological fields were prepared using the Advanced Research Weather Research and Forecasting [57] model. The initial and boundary conditions are taken from the application of the CMAQ model for the Northern Hemisphere, thus capturing the transport of pollutants from outside the U.S. into the study domain. The CMAQ model simulates the air pollutant concentrations through a detailed treatment of the various physical and chemical processes involved in the formation, growth, transport, and transformation of air pollutants. We used the Carbon Bond 6 mechanism revision 3 (CB6r3) [40, 41] including treatment of aerosols and aqueous chemistry (AERO6). We have disabled the inline wind-blown dust calculations whereas lightning emissions are included in the model simulations. The CMAQ model simulates the effect of non-methane VOCs, but does not simulate the effects of methane emissions, since the runtime of a CMAQ simulation is not long enough to capture these effects. The lifetime of methane, and the timescale of the consequent impacts on ozone, is longer than the timescales that are relevant from a regional air quality perspective.
The impact of the oil and gas sector is modeled through two scenarios where the oil and gas sector emissions are turned on or off while keeping all other natural and anthropogenic emissions constant in both simulations. We modeled four individual months (including a 10 day spin up each time), January (winter), April (spring), July (summer), and October (fall), as representative of seasonal variation of characteristics for PM2.5, NO2, and O3, and constructed pseudo-annual average from these 4 months. The emissions from all other sectors—both natural and anthropogenic were kept constant at their respective levels from 2016. We computed the number of grid-cells in the modeling domain that exceeded the policy-relevant metrics of daily maximum 8-hour average O3 (MDA8O3) exceeding 70 ppb, daily average PM2.5 exceeding 35 μg m−3 in each of the four seasons, and annual average PM2.5 exceeding 12 μg m−3 for each of the policy scenarios. Details on the setup of the meteorology data and on CMAQ model evaluation are available in the SI.
2.4. Health impact modeling
The population data in BenMAPR, providing population counts by age group and census tract, was obtained from the U.S. Census 2014–2018 American Community Survey. Baseline mortality rates by county were estimated using county mortality rate data from the U.S. Centers for Disease Control Wide-ranging Online Data for Epidemiological Research (U.S. CDC WONDER) dataset for 1990–2016 [45]. Baseline adult hospitalization and morbidity rates were obtained from the Healthcare Cost and Utilization Project [58] as available in BenMAP [42], and child health morbidity rates at county level were obtained from CDC WONDER [45] or literature review, at finest geographical scale available. CRFs for each pollutant relating increased exposure to a pollutant to increased risk of a health outcome were sourced from the epidemiological literature. Similar to previous research, we relied on CRFs from either meta-analyses featuring multiple epidemiological studies, or from large, multi-location, or multi-year cohorts when available [59, 60]. However, unlike previous impact assessments, we have used a CRF for mortality and long-term exposure to ozone, and have included both mortality and childhood asthma from long-term exposure to NO2 [12, 13, 50, 51]. For other health outcomes, we used CRFs that are common in regulatory analyses from the U.S. EPA in BenMAP [42, 43, 61], including health outcomes in both adults and children. Each health outcome, CRF, background health data, and citations are provided in supplementary tables 1, 2, and 3.
The population density for each age group within each tract was calculated using the area of each census tract, and merged with morbidity and mortality rates by age group and by location (supplemental table 1). This spatial layer was then intersected with the 12 km × 12 km CMAQ grid to produce a spatial layer of polygons with the tract population density by age group, morbidity and mortality rates by age group for that tract, and air pollution from the gridded CMAQ output. Total health impacts of air pollution were then calculated for each polygon using the air pollution concentrations provided by CMAQ, population density, polygon area, corresponding health outcome rate, and the CRFs for NO2, PM2.5 and ozone as follows:

CRFs are presented in supplemental table 2. The central estimates and 95% CIs were used to calculate the corresponding central estimates and 95% CIs for each health outcome. The resulting layers were then aggregated up to county, state, and national geographies using the corresponding geographical boundaries. Results from the 2016 baseline scenario were compared with the 2016 scenario with O&G emissions removed to calculate the health impacts of emissions from the O&G sector.
2.5. Health impact valuation
Health impact valuation functions in BenMAPR were obtained from BenMAP and then updated using results from the literature when updated valuation functions were available. All valuation functions were adjusted upward for inflation to 2016 USD, and values are provided in supplemental table 3. We use a value of statistical life (VSL) of $10.3 million ($6.2–$14.5 million) in 2016 USD. This was derived from the U.S. EPA base VSL [42, 43], adjusted upward to 2016 USD currency year and for income-based increases in willingness to pay, based on standard income elasticity calculations within BenMAP [42, 43]. Valuation functions for morbidity outcomes were based on the literature and values provided within BenMAP and are presented in supplemental table 3.
2.6. Climate impact valuation
We valued climate impacts of GHG emissions using estimates of the social cost of greenhouse gases from the U.S. Interagency Working Group on the Social Cost of Greenhouse Gases [62]. We used the values for emissions occurring in 2016, and used the value from the 3% discount rate as our middle value, the 5% discount rate for our low, and the 2.5% for our high, using 2016 USD. This value captures impacts due to additional warming from greenhouse gas emissions through a subset of pathways related to climate change, including sea level rise, impacts to agriculture, some catastrophic events, some infectious diseases, and other impacts over the lifetime of each chemical type, and then discounted to net present value. Air pollution-related health impacts are not a pathway included in the U.S. Social Cost of GHGs. The Social Cost of GHGs is likely to be an underestimate of the total impacts due climate change since a number of health-relevant pathways are not included, notably, malnutrition [63]. This value also does not include health impacts of air pollutant formation due to methane emissions, especially formation of ozone [63].
3. Results
3.1. Oil & gas emissions and air pollution in 2016
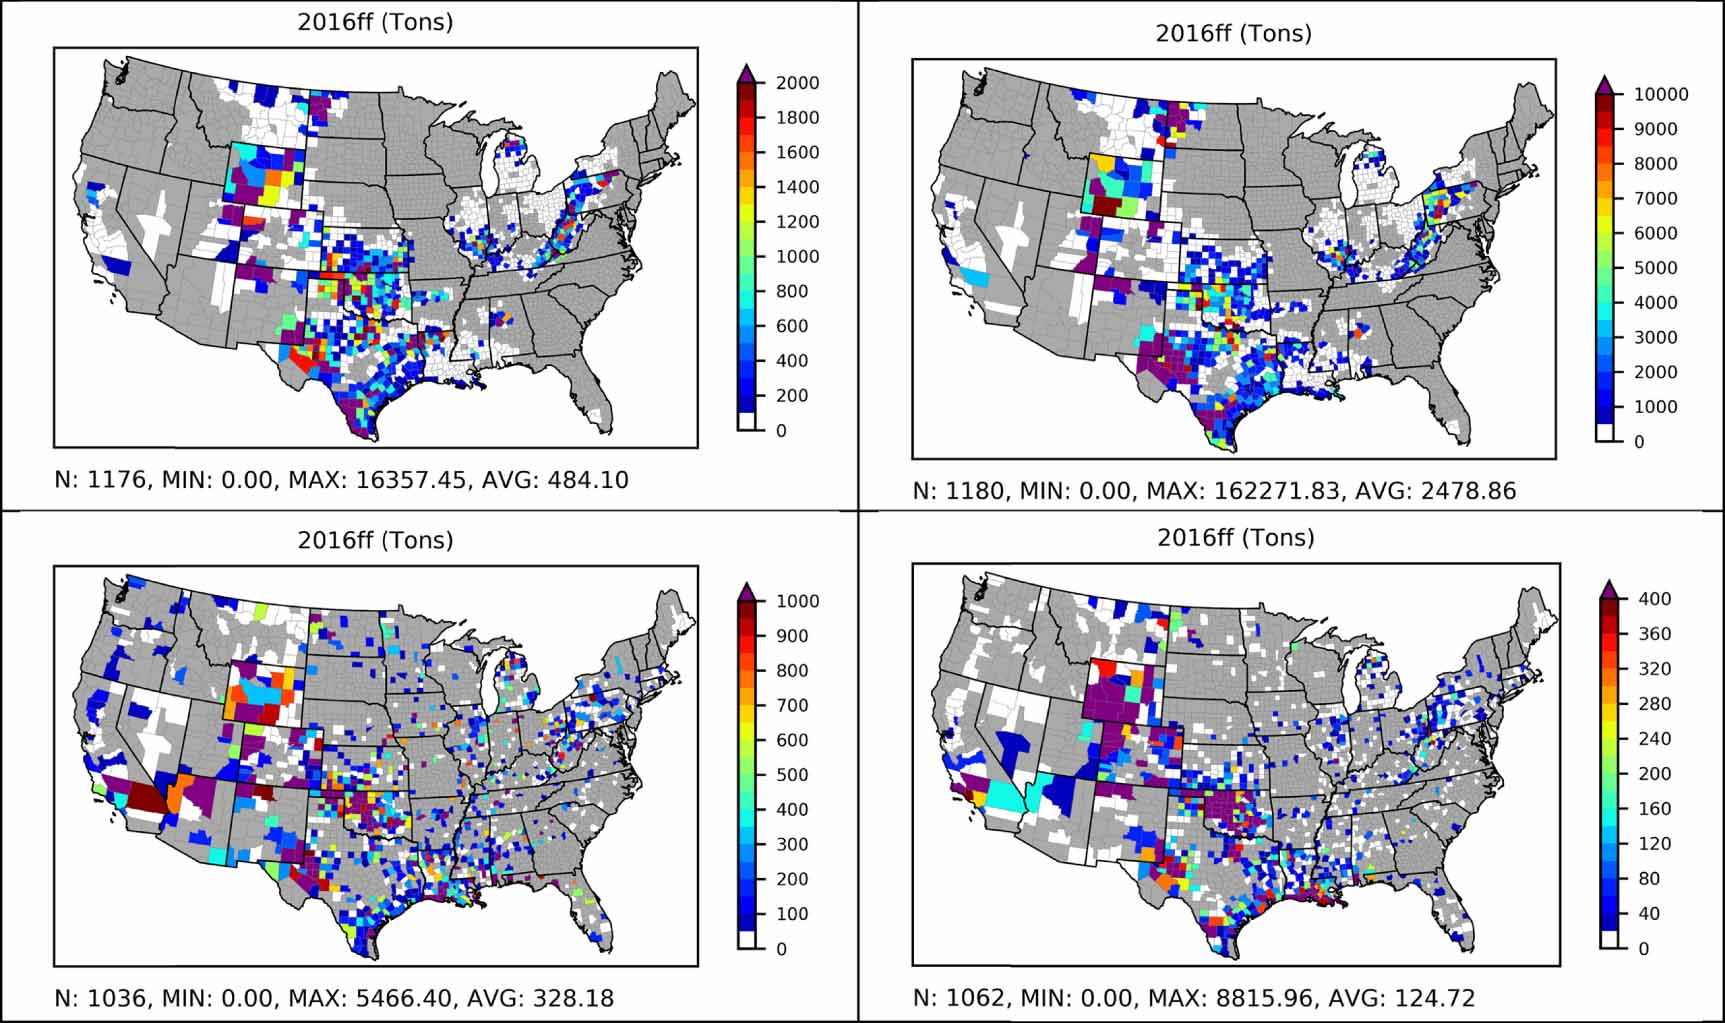
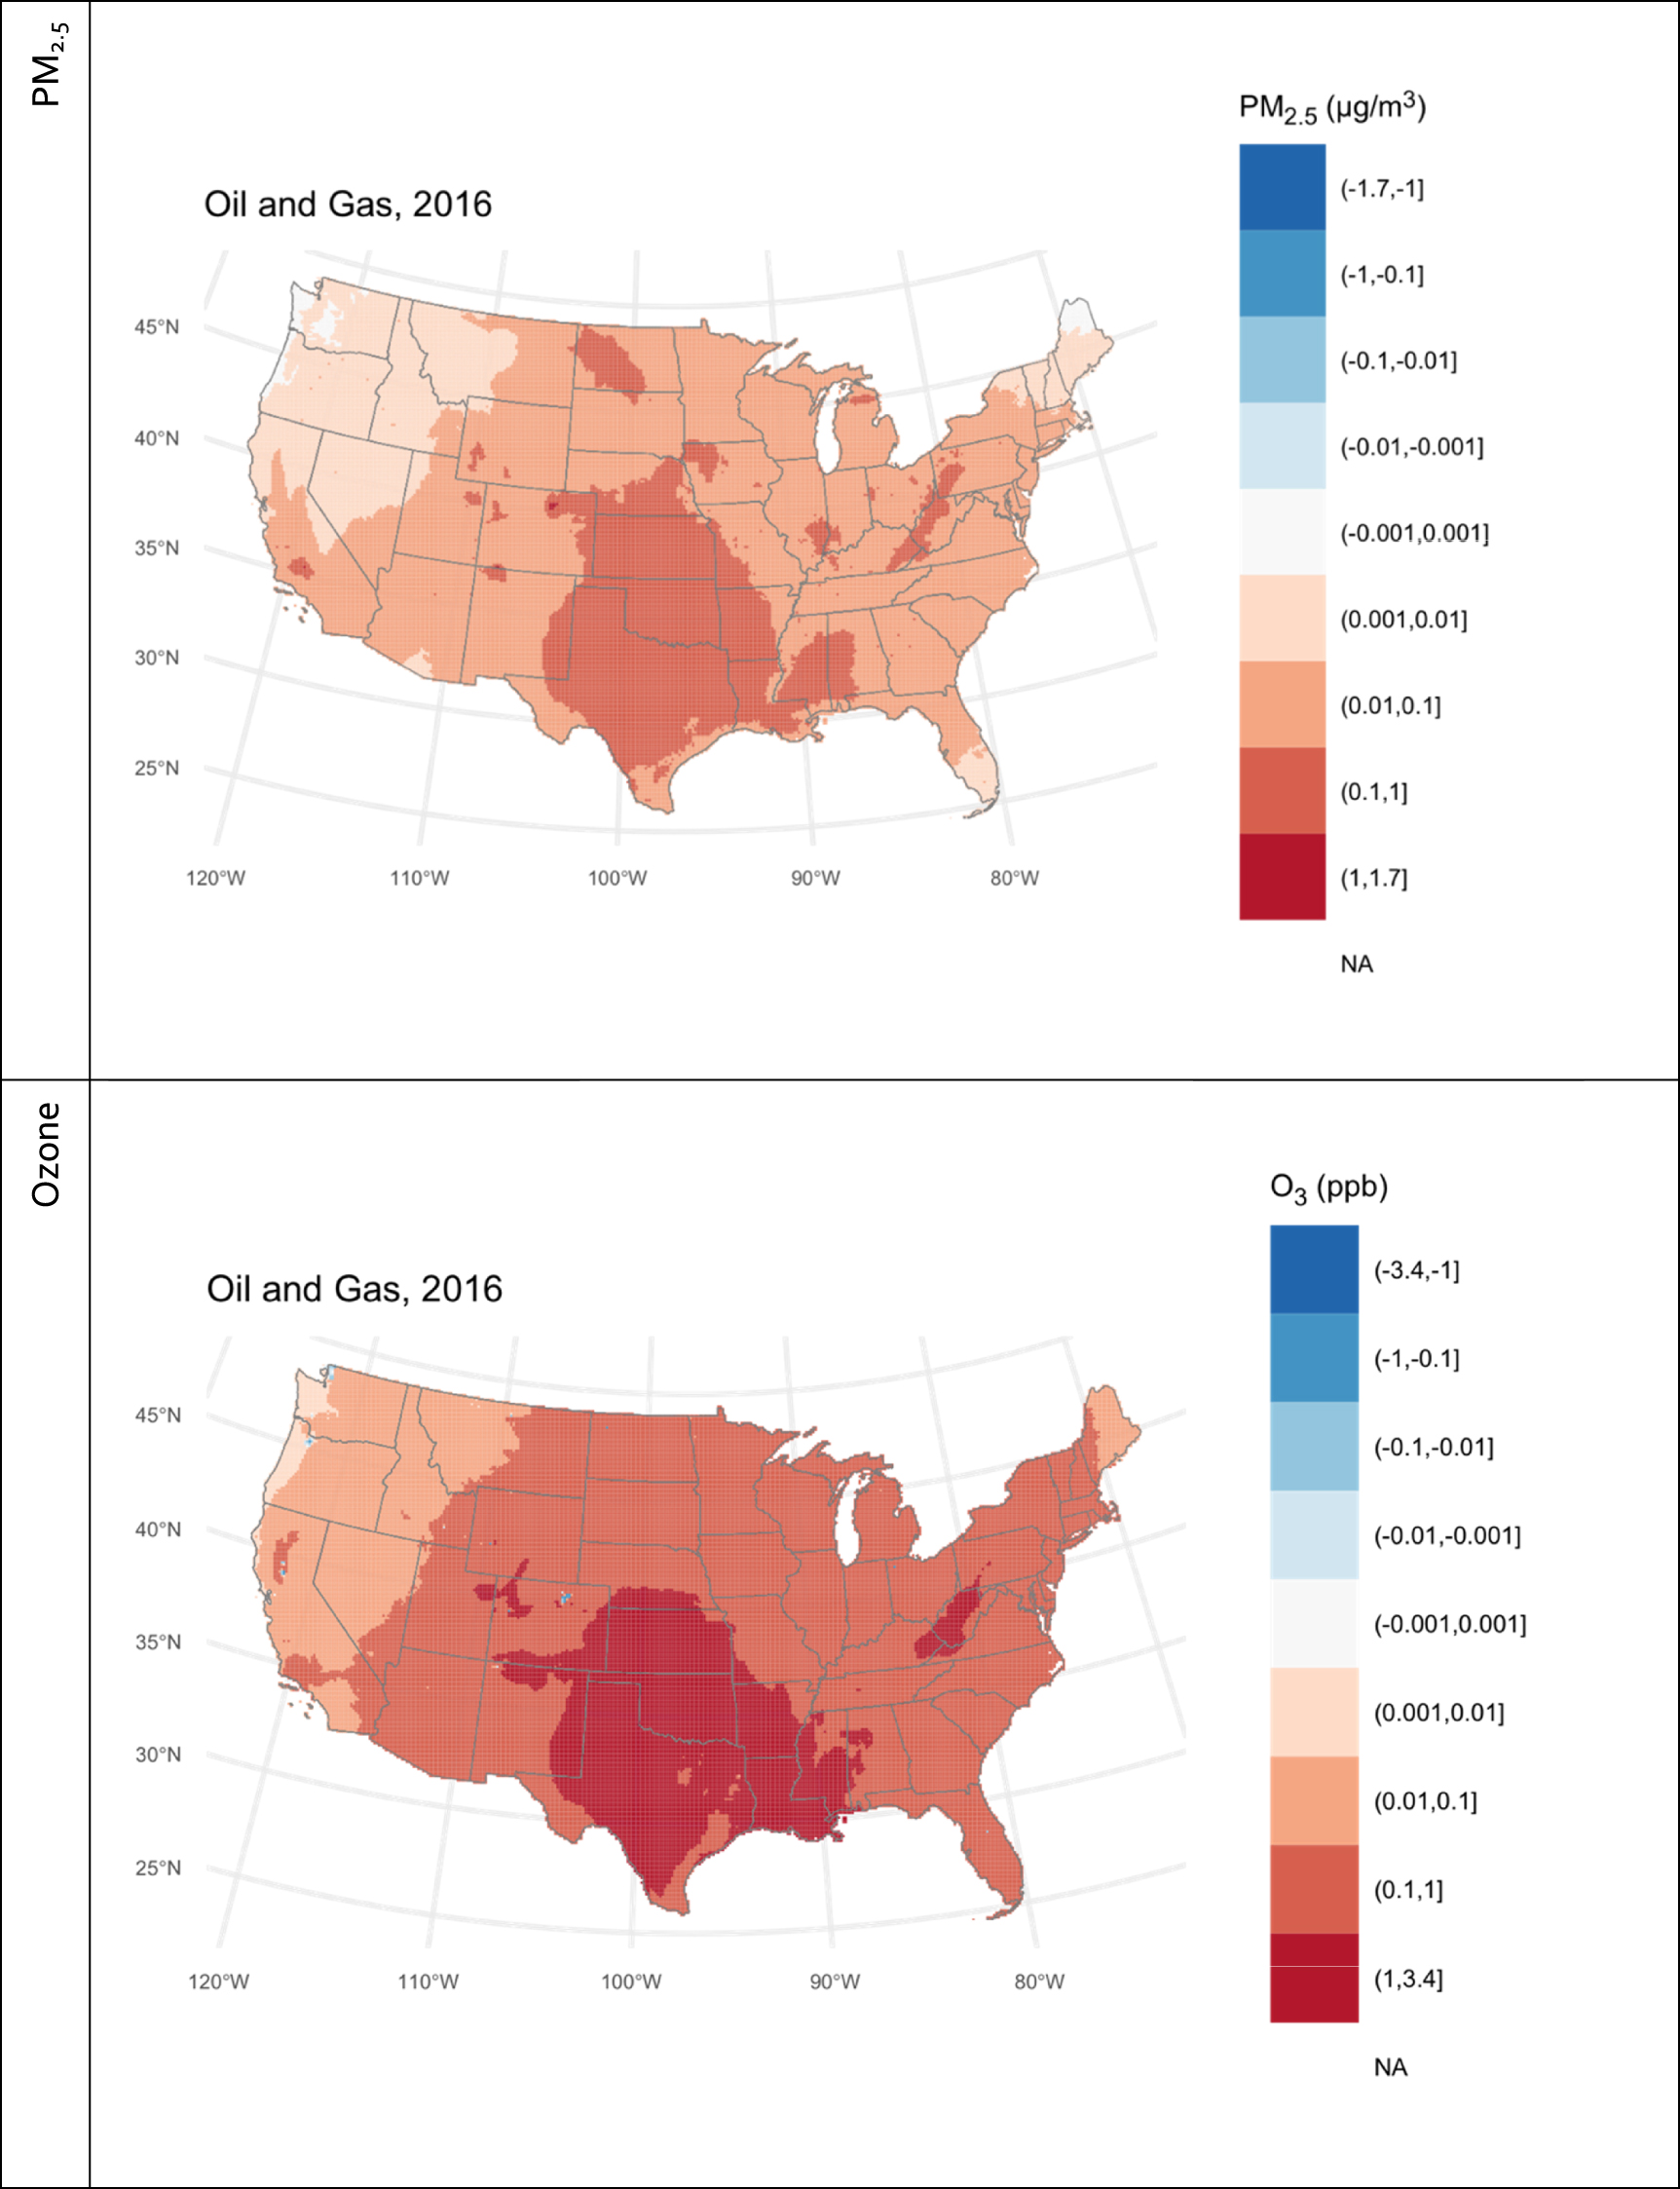
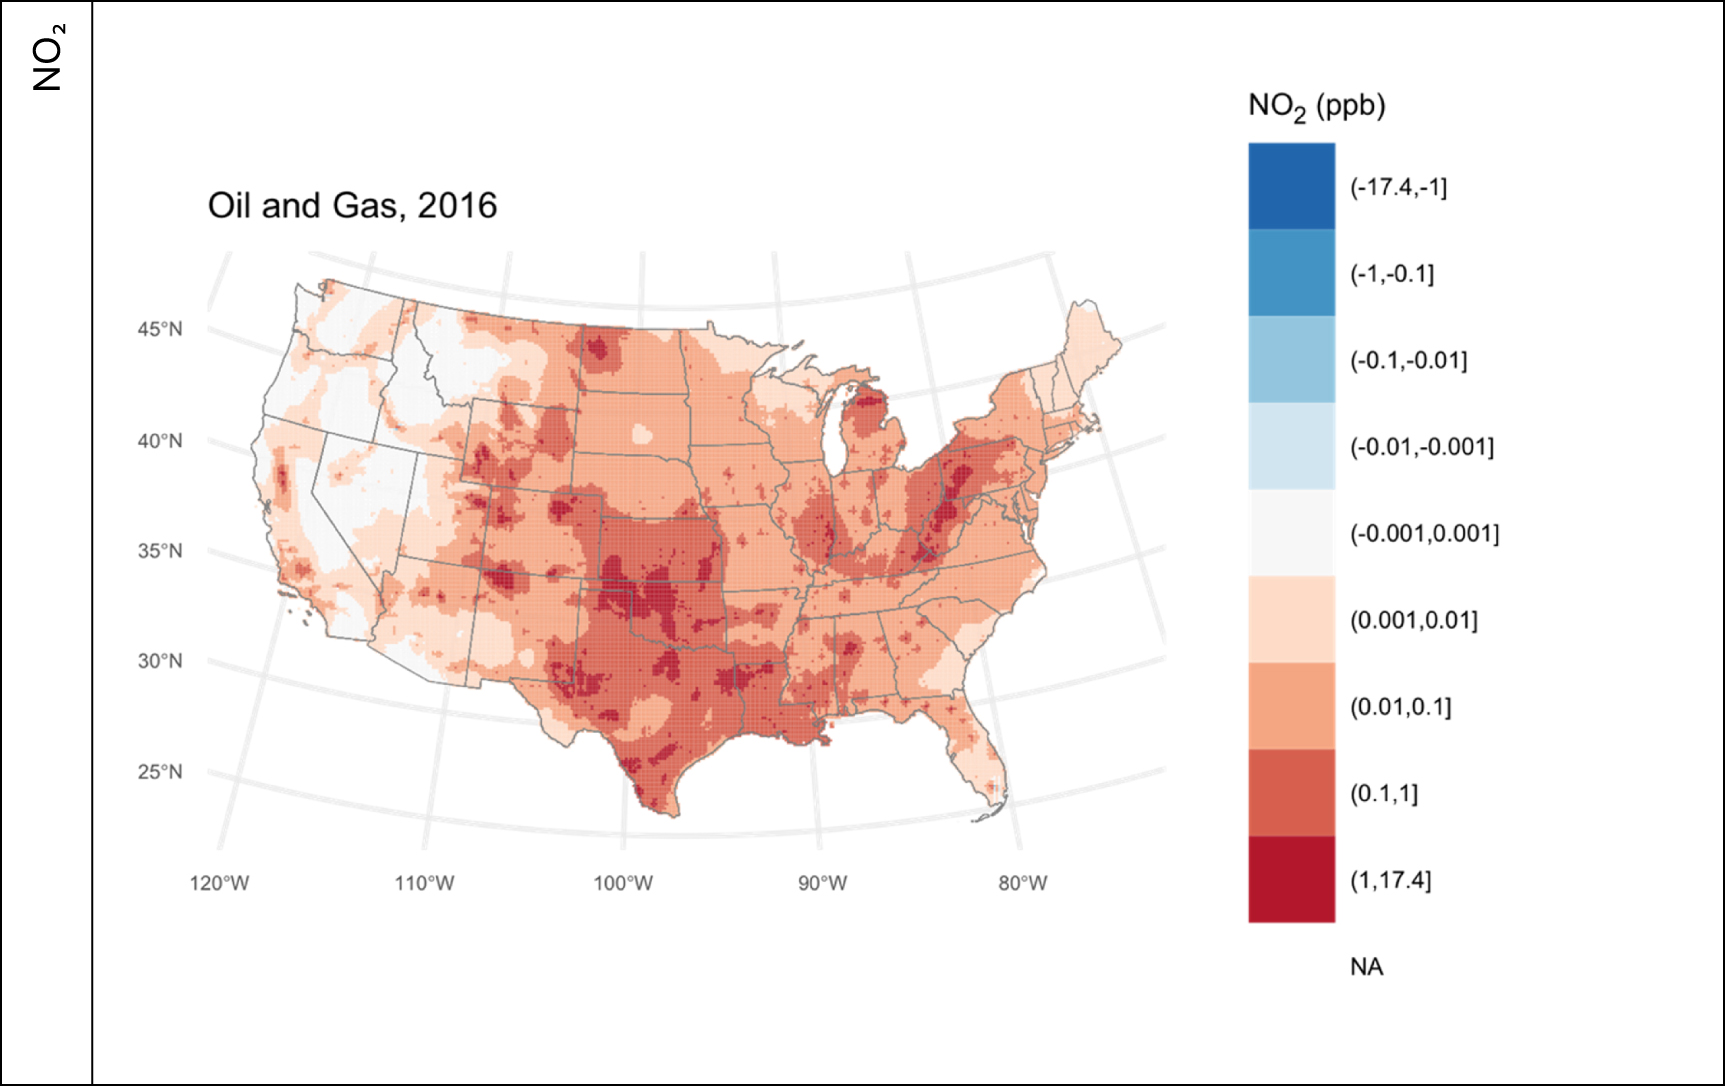
The major emissions of CH4 and NMVOCs from the O&G sector account for about 21 and 2.9 million U.S. tons (all units of tons are U.S. tons, unless otherwise stated) followed by NOx (1 million tons yr−1), SO2 (54.7 thousand tons yr−1), PM2.5 (25.9 thousand tons yr−1) and NH3 (4.3 thousand tons yr−1) in 2016 (table 1). These emissions largely originate from oil and gas producing regions in Texas, Oklahoma, Wyoming, Colorado, North Dakota, Pennsylvania, West Virginia and southern California (figure 1). Alvarez et al [1] report a national methane estimate of 13 million tons (Tg) using a facility-based bottom-up estimate vs. the U.S. EPA's GHG estimate of 8 million tons (Tg). The CH4 emissions from National Emissions Inventory in our study is computed using process-specific chemical speciation profiles based on estimated emissions of total organic gases in the EPA's SPECIATE database [64]. The difference in methane emissions between the U.S. EPA GHG Emissions Inventory and the National Emissions Inventory largely stems from a discrepancy in emissions from emissions from a process related to coal bed methane in WY. The emissions from the O&G sector as estimated by the NEI contributed between −0.001–1.7 µg m−3 of PM2.5, −0.42–2.7 ppb of ozone, and between −0.014 and 17 ppb of NO2 across our modeling domain during the 4 modeled months in the pseudo-annual average (figure 2). During these 4 modeled months, this pollution was enough to result in 634 instances of 12 km × 12 km grid cell exceedances of the daily maximum 8-hour average ozone concentration National Ambient Air Quality Standard (NAAQS), 29 exceedances the daily PM2.5 NAAQS, and 1 exceedance of the annual PM2.5 NAAQS generally downwind of oil & gas producing regions (table 1, supplementary table 3), where the PM2.5 is made up of a mix of largely nitrate, ammonium, and organic matter components (supplementary figure 1, supplementary table 5).
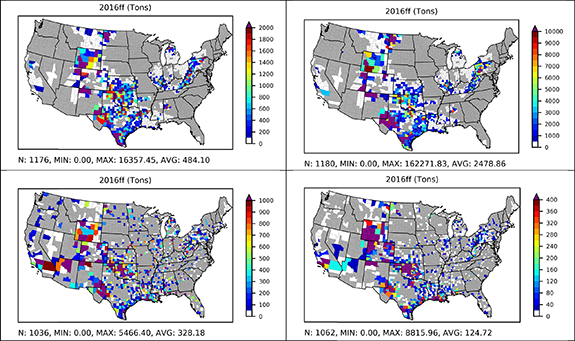
Figure 1. Oil and gas emissions of NOx (left), VOCs (right), non-point sources (top) and point sources (bottom) in the EPA NEI 2016 v1 modeling platform. Note: the color scale for each map is different for readibility.
Download figure:
Standard image High-resolution image
Download figure:
Standard image High-resolution image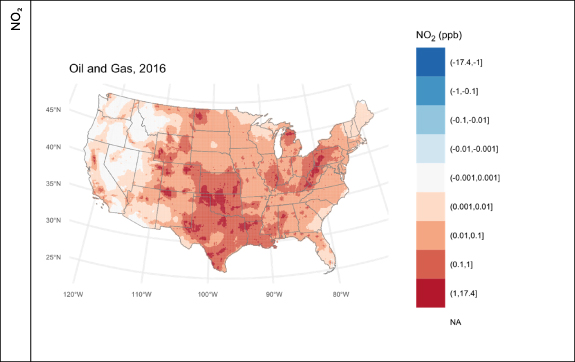
Figure 2. Change in annual average concentration of PM2.5, ozone, and NO2 due to oil and gas (O&G) air pollution in 2016. Note that the color axes are categorical and roughly logarithmic. Square brackets indicate that the end value is included in that range, with parenthesis indicating that the corresponding number is not included in the category.
Download figure:
Standard image High-resolution imageTable 1. Oil and gas sector emissions (in U.S. tons) and source contribution to air quality.
| Metric | 2016 air pollution contribution | Contribution to total U.S. emissions (%) | |
|---|---|---|---|
| Emissions contribution (tons yr−1) | CH4 | 21 343 548 | 2.2% |
| NMVOCs | 2994 766 | 24.8% | |
| NOx | 1002 690 | 10.7% | |
| SO2 | 54 669 | 19.4% | |
| PM2.5 | 25 973 | 0.9% | |
| NH3 | 4364 | 0.1% | |
| PM2.5 changes (µg m−3) in each grid cell | Min | −0.001 | |
| Mean | 0.065 | ||
| Max | 1.682 | ||
| Grid cells with daily PM2.5 exceedances (>35 µg m−3) | Annual | 29 | |
| Grid cells with annual PM2.5 exceedances (>12 µg m−3) | Annual | 1 | |
| Ozone changes (ppbv) in each grid cell | Min | −0.423 | |
| Mean | 0.602 | ||
| Max | 2.701 | ||
| Grid cells with 8 h ozone exceedences (>70 ppbv) | Annual | 634 | |
| NO2 changes (ppbv) | Min | −0.014 | |
| Mean | 0.17 | ||
| Max | 17.183 |
3.2. National health burden and distribution of risks from oil and gas attributable air pollution
In 2016, the total health impacts of air pollution from the O&G sector included 7500 (95% CI: 4500–12 000) lives lost, 2200 (95% CI: 830–3200) new childhood asthma cases, and 410 000 (95% CI: 9200–810 000) asthma exacerbations with total value of $77 billion ($27 billion–$170 billion) (tables 2 and 3, supplementary table 6). Of the deaths in 2016 due to O&G pollution, 2,100 (28%) were due to PM2.5, 2600 (35%) were due to ozone, and 2800 (37%) were due to NO2 (tables 2 and 3, supplementary table 6).
Table 2. Health impacts of O&G in 2016. Full health impacts are in supplementary table 4.
| Health outcome | Pollutant (s) | Cases (95% CI) |
|---|---|---|
| Premature deaths | All three | 7500 (4500–12 000) |
| Asthma incidence | PM2.5 and NO2 | 2200 (830–3200) |
| Asthma hospitalizations | PM2.5 and NO2 | 53 (1.2–110) |
| Asthma ED visits | PM2.5 and NO2 | 530 (12–1100) |
| Asthma exacerbations | PM2.5 and NO2 | 410 000 (9200–810 000) |
| Respiratory hospitalizations | PM2.5 and ozone | 1500 (550–2400) |
| Heart attacks | PM2.5 and NO2 | 270 (150–390) |
Table 3. Monetary value of health impacts of O&G in 2016. Full health impacts are in supplementary table 4.
| Health outcome | Pollutant | Value ($2016 USD) (95% CI) |
|---|---|---|
| Premature deaths | All three | $77 billion ($27 billion–$170 billion) |
| Asthma incidence | PM2.5 and NO2 | $130 million ($20 million–$300 million) |
| Asthma hospitalizations | PM2.5 and NO2 | $970 000 ($22 000–$1900 000) |
| Asthma ED visits | PM2.5 and NO2 | $240 000 ($5200–$500 000) |
| Asthma exacerbations | PM2.5 and NO2 | $24 million ($200 000–$80 million) |
| Respiratory hospitalizations | PM2.5 and ozone | $44 million ($16 million–$72 million) |
| Heart attacks | PM2.5 and NO2 | $19 million ($11 million–$27 million) |
| Grand total | All three | $77 billion ($27 billion–$170 billion) |
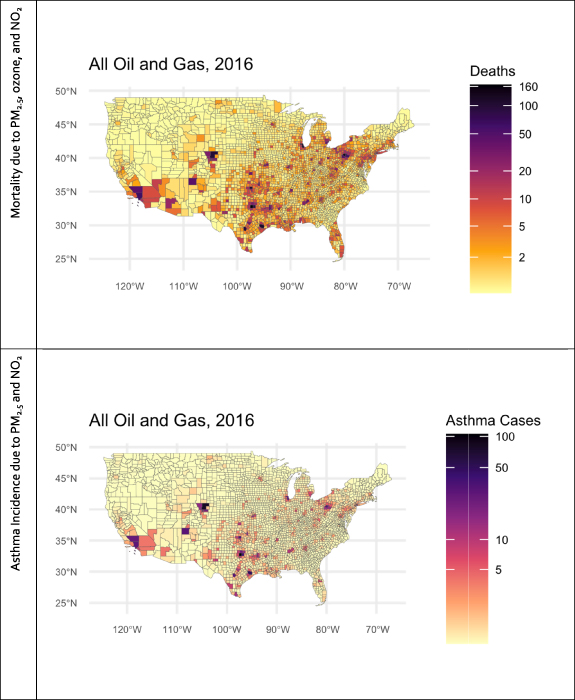
The spatial distribution of the health impacts follows a spatial pattern that reflects the underlying changes in air quality intersected with population distribution (figure 3, supplementary figures 2 and 3). Attributable mortality cases per million people are largely centered around O&G producing areas—Texas (TX), Louisiana (LA), Oklahoma (OK), western Pennsylvania (PA), West Virginia (WV), and North Dakota (ND), and a few counties in Colorado (CO), Wyoming (WY), and New Mexico (NM). Childhood asthma follows a spatial pattern that is similar but more constrained, since our model incorporates increased asthma risk from PM2.5 and NO2. Many heavily impacted cities are just downwind of O&G activity, including Denver CO, cities in TX including Dallas, Houston, Fort Worth, and San Antonio, and Pittsburgh PA. However, some cities far downwind also experience substantial impact—Chicago, Illinois (IL), Boston, Massachusetts (MA), New York, New York (NY), Philadelphia, PA, Washington, District of Columbia (DC), and Baltimore, Maryland (MD), all experience some health impact from O&G air pollution. This is reflected in the state ranking of health impacts (figure 4)—states with heavy O&G activity and emissions, like TX, OK, and PA, generally have the highest total impact, but some heavily populated states that are downwind of O&G states, but do not have O&G activity themselves, like IL, NY, and Georgia (GA) have health impacts from O&G higher in proportion than their emissions. When normalized to population, the health impacts per million people track closely with attributable air pollution exposures. States with high O&G related emissions but mid to low population, like OK, CO, WY, ND, and NM have the highest impacts per million people (figure 4, supplemental tables 7–12).
Download figure:
Standard image High-resolution image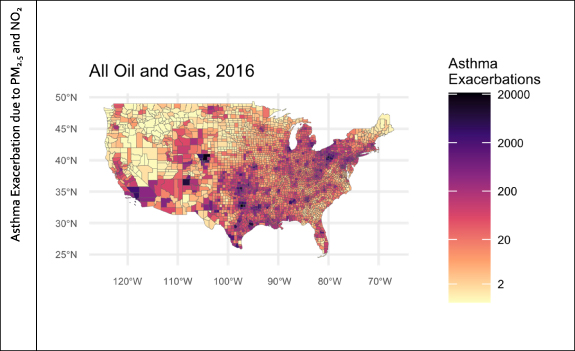
Figure 3. Mortality due to PM2.5, ozone, and NO2, and asthma incidence and asthma exacerbation due to PM2.5 and NO2 from oil and gas (O&G) in 2016.
Download figure:
Standard image High-resolution image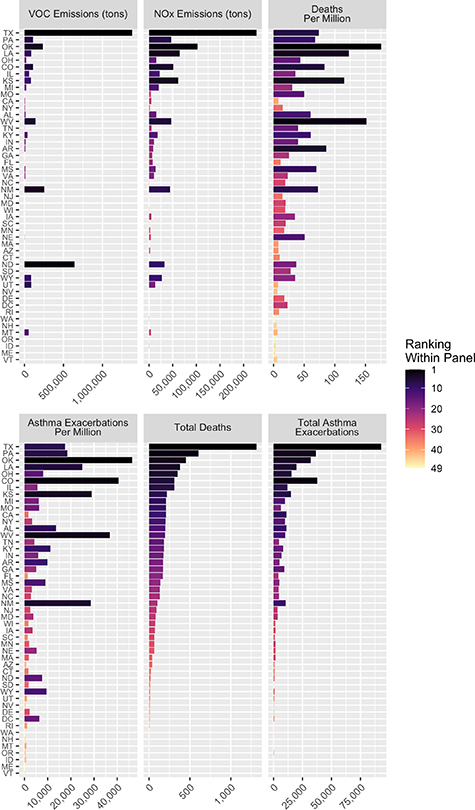
Figure 4. State level impacts of oil and gas production in 2016, in terms of state level emissions (in U.S. tons) of NOx and VOCs, state level total deaths and deaths per million due to PM2.5, ozone, and NO2 and total asthma exacerbations and asthma exacerbations per million due to PM2.5 and NO2. States are ordered by ranking of total number of deaths in state, and color indicates the ranking of each state by the variable indicated in each panel.
Download figure:
Standard image High-resolution image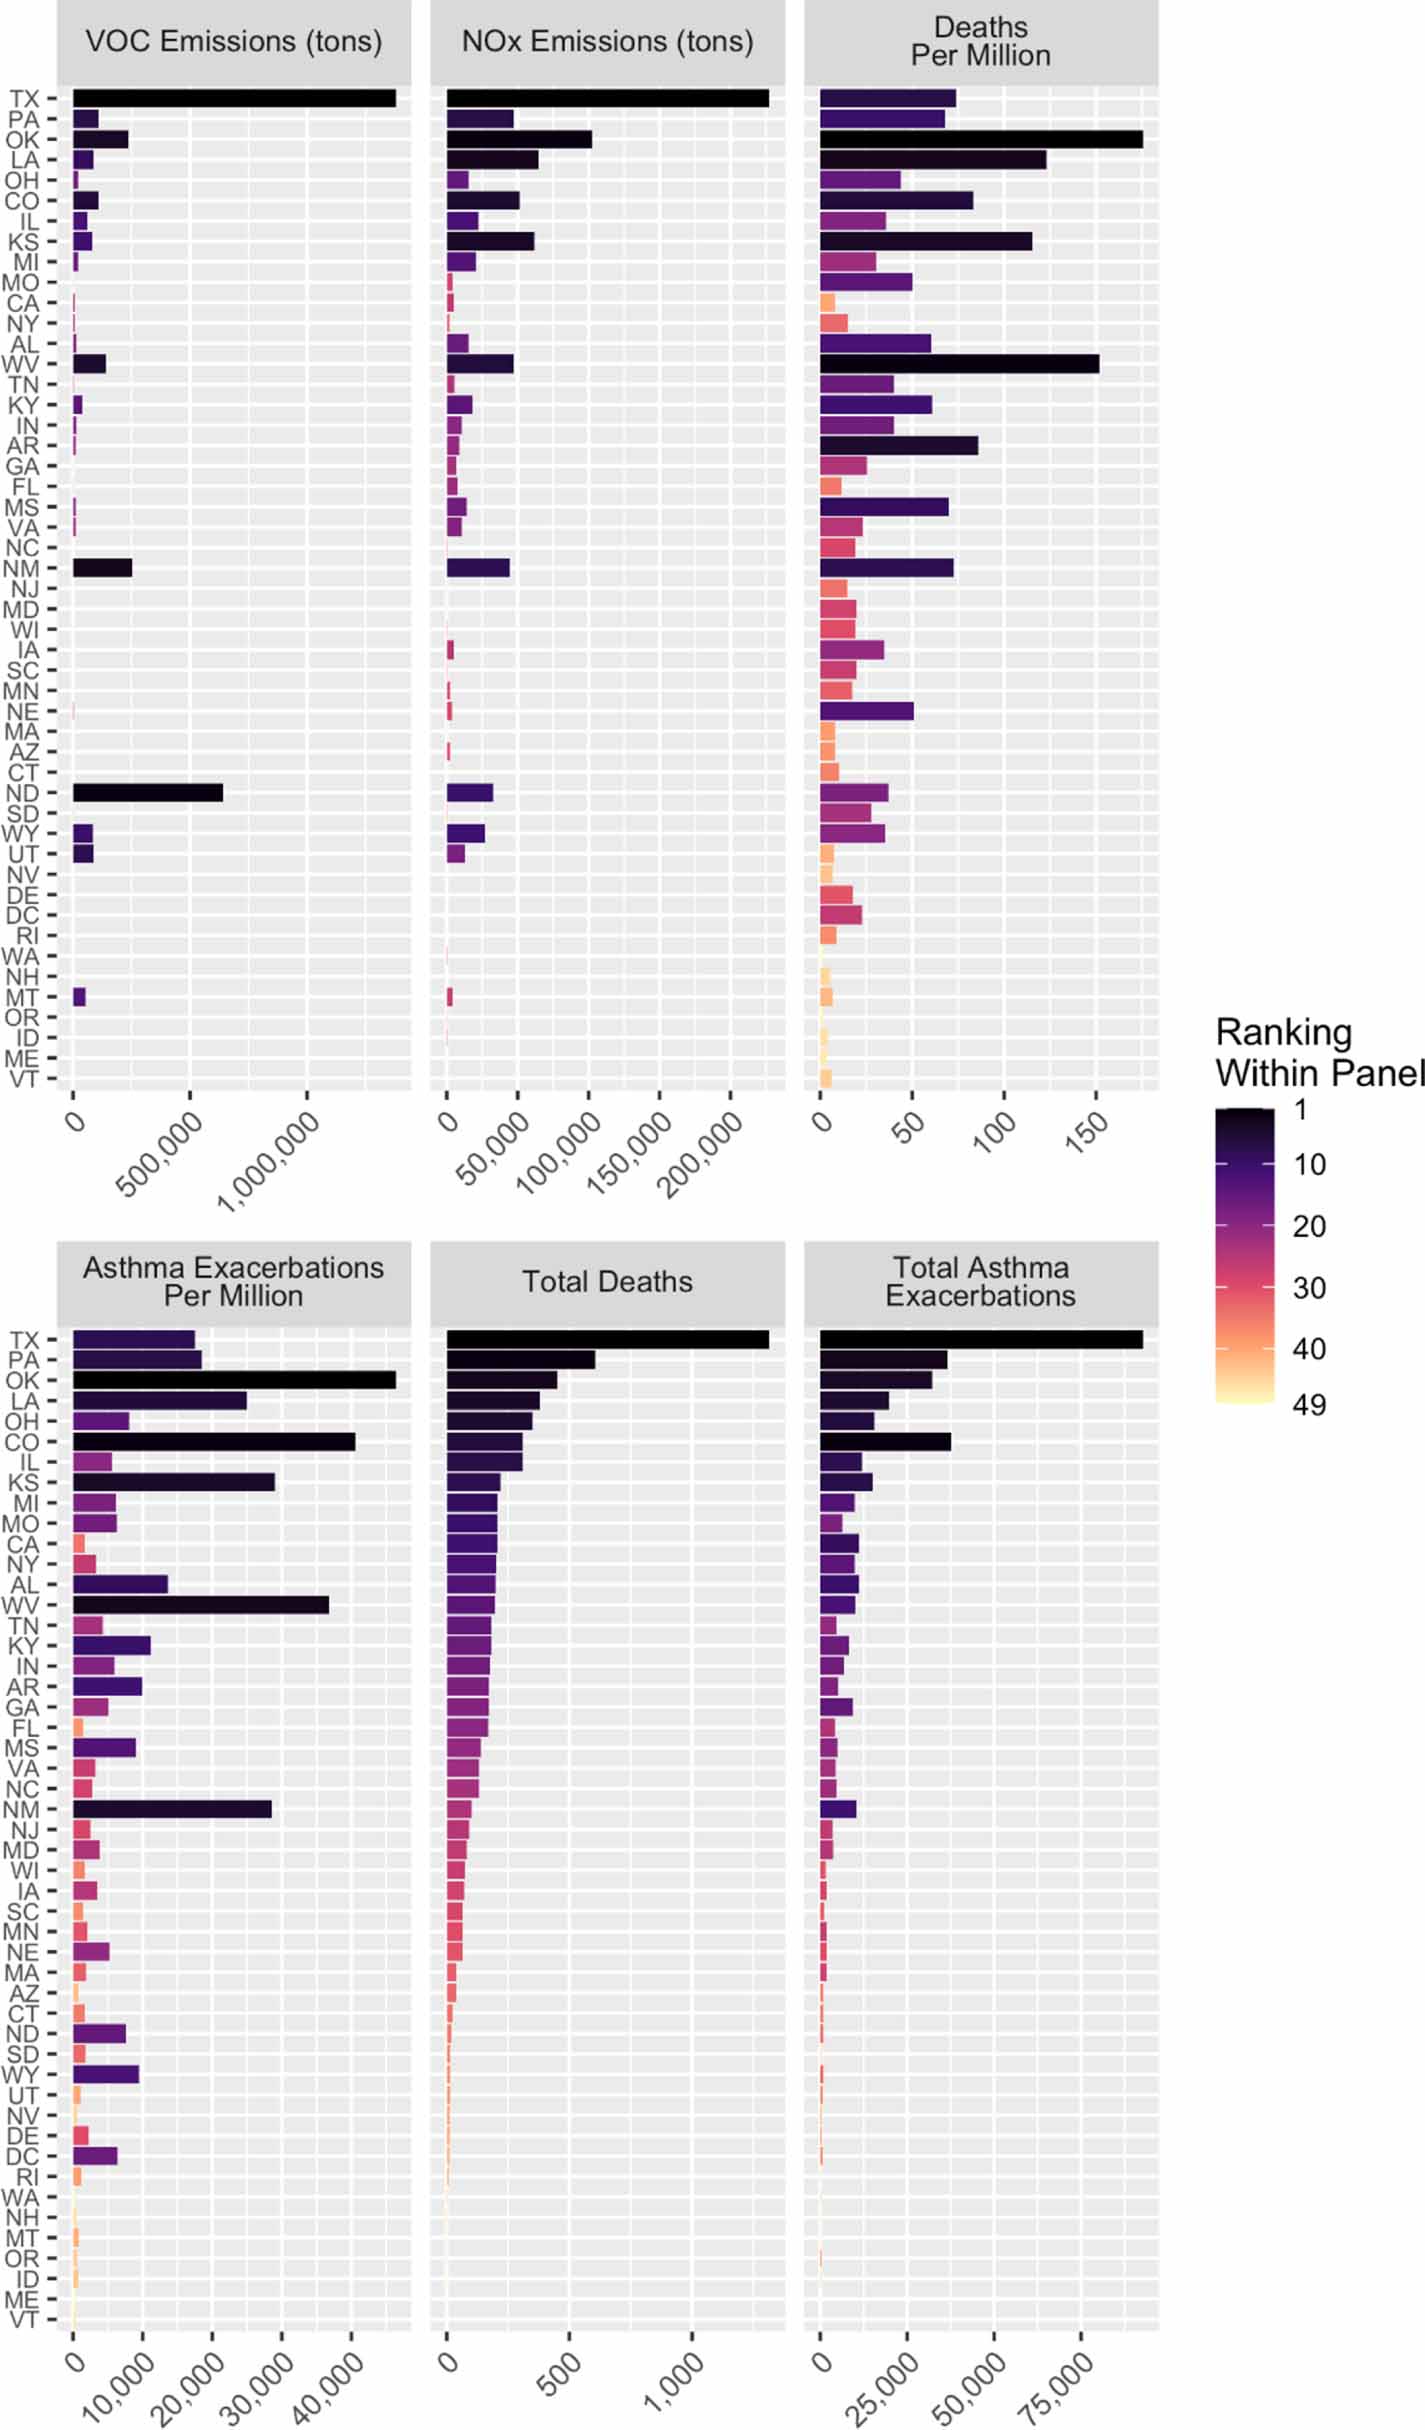
3.3. Health and climate impact valuation
The total health impacts of air pollution emissions from oil and gas in 2016 totaled at $77 billion (95% CI: $27 billion–$170 billion), with over 99% of this coming from mortality. The total estimated climate impact of oil and gas production estimated using the U.S. Social Cost of GHGs which incorporates only impacts from climate change and does not incorporate air pollution-related health impacts, was $11.1 billion (low estimate: $4.3 billion, high estimate: $15.5 billion). Of this, $8.3 billion was from gas production, with $7.0 billion of that from methane emissions, and $2.8 billion was from oil, with $2.0 billion from methane emissions. The total impact of oil & gas extraction, accounting for both climate and health impacts from regional air pollution is $92.5 billion, with health making up 83% of the total damages. Additionally, per average ton of methane emitted from oil & gas production (as reported by the EPA GHG inventory), there is $10 700 of health damages from air pollution emissions, and $289 in additional climate impacts from CO2 and N2O emissions that occur alongside the approximately $1200 in climate impacts per ton of methane.
4. Discussion
This analysis shows that in 2016, there were substantial health impacts of air pollution from oil and gas production. These impacts are fairly concentrated in regions with O&G production, however there is notable spread to areas outside major O&G producing regions. The impact on NAAQS exceedances is likely an underestimate due to our use of pseudo-annual averages. NO2 is the largest contributor to health impacts, followed closely by ozone and then PM2.5. NO2 impacts are the most tightly constrained, and ozone is the most dispersed, with substantial regional spread, reflecting the atmospheric lifetime of NO2 and PM2.5, and the time for formation of secondary PM2.5 and ozone from precursor emissions [9]. The five states with the highest impacts due to O&G pollution—TX, PA, OH, OK, and LA—all have high levels of O&G activity. However, IL and NY have the 6th and 8th highest impact, despite having little O&G activity in-state.
It also shows that the health impacts of O&G production are very dependent on location. This has implications for the benefits of local and state strategies to reduce emissions from O&G production, including methane and NMVOC emissions reductions, flaring, emissions from compressor stations, and other emissions sources involved in O&G production. Our work indicates that the health benefits per ton of methane reduced will also vary substantially by location, meteorology, background pollutants, specific control technology, process with emissions control installed, and populations downwind. Substantial variation by location has been seen in other policy analyses such as assessments of CO2 emissions reductions policies in electricity [10, 65]. For example, an assessment of co-pollutant cost of carbon for the U.S. electrical sector found that at state-level, co-pollutant costs varied by a factor of more than 13× between different states [10, 65]. A similar degree of variability in the co-pollutant benefits of methane reduction may exist between different methane reduction or other emissions reductions strategies, and different states, along with potential non-linearities in atmospheric response and changes due to interactions with other pollutants emitted by the sector, and other sources. Therefore, explicit atmospheric modeling may be necessary to have a reliable, location-specific, quantification of benefits to a policy on the oil & gas sector.
Our results for air pollution impacts are fairly similar to a recent assessment by Fann et al of projected oil & gas air pollution health impacts in 2025 [22]. Similar to our results, Fann et al showed highest PM2.5 and ozone contributions from O&G production in TX, OK, KS, ND, CA, western PA and WV, with highest concentrations in eastern CO [22]. The health impacts results are also similar, after adjusting for differences in choices of CRFs. Our results for mortality from PM2.5 were roughly 2× higher than in Fann et al, corresponding to our use of a CRF that was also roughly 2× higher. Our results for ozone are also higher by just over 2×, largely due to our use of a CRF that accepts annual average changes in ozone, while Fann et al used a CRF for daily ozone concentration and only used changes in ozone occurring during ozone season, which is 5/12 of a year. Fann et al did not model health impacts from NO2.
4.1. Limitations & strengths
Our results here are subject to several assumptions and uncertainties throughout the modeling chain. The emissions inventories used here are likely to underestimate NMVOC emissions [1]. Additionally, the number of compressor stations in the emissions inventory may also be undercounted. In PA, for example, the EPA inventory of point sources in 2017 contains 72 compressor stations in PA [7]. A recent study in PA found that 361 compressor stations were operational in 2013 [66]. Additionally, the PA Department of Environmental Protection has 353 permitted compressor stations in 2013 and 547 permitted in 2016 [67]. These missing emissions, along with uncertainties in the CMAQ model and interactions with these missing emissions introduce additional uncertainty. The spatial resolution of the atmospheric modeling, while rather robust for most regional-scale applications and when compared to global-scale models, limits our ability to capture fine scale effects, which are likely to be important near O&G operations, especially within the first few km. Additionally, our implementation of CMAQ has a geographical scale of the continental U.S. and uses a series of representative months to represent seasonality, therefore it does not capture the global impacts due to ozone and particulate formation once methane enters global circulation, or the impacts of ozone and particulate formation that occur as methane oxidizes at the end of its 10–14 year atmospheric lifetime [62, 68–70]. These results could be used to provide an estimate of air pollution related health impacts due to co-pollutants per ton of methane emissions or total GHGs emitted from O&G, or an estimate of the health impacts of methane co-pollutants. However, this may not capture non-linearities in the response of air pollution levels to changes in emissions, or interactions with other air pollution sources that were not accounted for here, along with the other uncertainties inherent in this analysis. Even though the CRFs have independent health effect estimates, there could still be residual double-counting between pollutants. However, a recent independent meta analysis [71] and large nationally representative cohort studies indicate that long term ozone [12, 72, 73] and NO2 have additional effect on mortality beyond PM2.5 [74–76].
Additionally, the CRFs and background health data used here do not capture differences by race/ethnicity, income, or education levels. Morbidity outcomes are generally reported at state level rather than county level. This limits our ability to capture possible interactions leading to increased impact in communities near O&G activity, and potential exposure disparities between different socio-economic segments of the population. Since our model exclusively captures health impacts from three of the criteria pollutants that have national health-based standards—ozone, PM2.5, and NO2—we omit health benefits from reductions to other hazardous pollutants that can exist at high concentrations near O&G production, like benzene, toluene, ethylbenzene, xylene, formaldehyde, and acetaldehyde, among others [28, 77]. Additionally, this study focuses on air quality and health impacts from O&G production, transportation, and storage—the 'upstream' and 'midstream' portions of the supply chain, and therefore further underestimates the full health costs by omitting downstream combustion of oil, downstream and indoor combustion of natural gas, and potential health impacts of indoor gas leaks [8, 78, 79]. This assessment is therefore only a component of the full life cycle health impacts of oil & gas use.
Despite these limitations, we demonstrate substantial public health impact from the O&G sector. We demonstrate this using a robust method to evaluate health impacts of air pollution from emitting sectors that makes substantial advancements from previous models [23, 59, 80–83]. These advancements include new health-relevant air pollutants, detailed chemistry relevant to multipollutant formation [9, 55], updated epidemiology showing the relationship between long-term exposure to ozone [12] and increased mortality risk, and include impacts due to long-term NO2 exposure [13]. Our PM2.5 and ozone exposures are similar to previous work modeling the health impacts of O&G production [22], and our finding of elevated ozone concentrations, and widespread ozone formation of O&G in the central U.S. is similar to satellite observations [84] and modeling studies [22, 85]. Our estimates of the health impacts of PM2.5 from O&G are fairly similar to previous findings [22]. However, our results for health impacts of ozone are much higher, reflecting our use of a CRF for long-term exposure to ozone [12, 22]. That, alongside our inclusion of NO2, results in substantially higher total health impacts of O&G production providing novel insights into the public health impacts of this sector, and providing motivation for targeted emissions reduction measures.
Furthermore, the substantial health impacts of O&G emissions quantified here point to potential future work where the emissions from each segment of the entire O&G sector can be tracked separately to identify which segments and which states contribute the most to the overall impacts for possible targeted emissions reduction measures, along with work apportioning impacts of each fuel. Also, the potential issues with VOC speciation in the emissions inventories point to additional work to refine these to assess potential changes in the health impacts quantified here.
4.2. Policy implications
Our work demonstrates that there are substantial health burdens from O&G production, which in monetary terms, are greater than the total impacts of the GHG emissions. These impacts may be a large contributor to total impacts of oil & gas use across each fuel's life cycles and are large contributors to benefit-cost assessments of emissions reduction policies for the O&G sector. Additionally, it shows that there are potential immediate health benefits of policies that reduce air pollutant emissions from O&G production. Our analysis demonstrates that air pollution policy assessments that focus on PM2.5 alone, without including long-term exposure to ozone or NO2, substantially underestimate total health benefits of air pollution reductions by over a factor of 3. This indicates that full assessments of air pollution benefits of policies should include changes in exposure to ozone and NO2, and that existing evaluations that exclusively focus on benefits from PM2.5 reductions most likely underestimate the total benefits.
Our research also demonstrates the regional nature of air pollution and health impacts from oil and gas production. While the states with significant oil and gas production see higher health impacts from production practices, there is substantial impact of oil and gas emissions on air quality and health in states with limited or no oil and gas activity, such as NY or IL. This implies that emissions controls on states far upwind can have benefits to these states. Understanding air quality impacts of oil and gas production emissions in these upwind states may have a role in non-attainment designations and state implementation plans for compliance with the NAAQS.
Additionally, our results indicate that assessments of impacts of O&G production or policies that affect all emissions but only use the social cost of methane might be underestimating benefits of reduced emissions associated with oil and gas production by a factor of nearly 10×, since the social cost of methane does not include the potential air quality health benefits from reduced methane emissions, or the social cost from the greenhouse gases CO2 and N2O, which are also emitted from oil and gas production. There was an additional $10 700 in air pollution related health impacts per ton of methane emitted from oil & gas production in 2016, and an additional $289 from non-methane GHGs. These represent substantial additional benefits that could be mitigated alongside benefits from reduced methane. These additional benefits should be quantified alongside the costs of available options for mitigating methane from oil and gas production [86]. This is relevant for the various states (NM [87, 88], CO [89]) and federal [86] agencies that have oil and gas sector specific requirements targeting mitigation along the natural gas supply chain and/or reductions in production.
This research also points out the potential for substantial benefits to policies that reduce oil and gas consumption, or impacts of policies that increase oil and gas consumption. However, these benefits are only visible in assessments that take the full life cycle health impacts of fuels into account—studies that exclusively focus on air pollution impacts from combustion emissions from end use of oil and gas overlook these impacts. This could be relevant for a number of decarbonization polices currently proposed. For example, California has recently announced a proposal to ban the sale of new gas [90] furnaces and water heaters beginning in 2030 and committed to 100% zero emission vehicle sales by 2035 [91]. These electrification policies are likely to reduce upstream oil and gas production emissions with air quality health benefits, but do not take that into consideration during cost benefit assessments, therefore they potentially underestimate total benefits. The reverse can be true for policies and activities that may increase consumption of oil & gas production, such as using gas as a feedstock for production of hydrogen, plastics, or other chemicals, or deployment of carbon capture and sequestration on gas-fired power plants [92]. This underscores the importance of including the health impacts of oil & gas production in evaluations of any energy policy that affects consumption of these fuels, and is an example of the importance of taking a life cycle view when evaluating the health consequences of energy policies more broadly.
5. Conclusions
O&G production has substantial health impacts alongside the climate impacts from methane emissions, and reducing emissions from the sector can have substantial health benefits through reducing exposure to ozone, PM2.5, and NO2, alongside benefits through mitigating climate change from methane reduction. These health impacts, and the benefits of policies, can extend well outside O&G producing regions, and make substantial contributions to air pollution and health impacts in populated areas far from O&G producing regions.
Acknowledgments
This work was financially supported by grants from the High Tide Foundation and the Environmental Defense Fund. We would like to thank Alique Berberian and Dr Frederica Perera for assistance compiling concentration response functions and background health data for health outcomes in children. We acknowledge Alison Eyth and Jeffrey Vukovich of the U.S. EPA for providing emissions inventories from the NEI collaboratory, and to all air quality scientists across multiple state, local, tribal, and regional agencies, and EPA and Federal Land Management agencies who were involved in the development of the national inventories. We also acknowledge the U.S. EPA for providing meteorological inputs from WRF and outputs from the CMAQ hemispherical scale simulations for extracting initial and boundary conditions used in this study. We would also like to thank attendees of our presentations at the American Geophysical Union conference in 2019 and the American Meteorological Society in 2021 for their feedback on initial results from this work.
Data availability statement
Emissions inventories are available at: www.epa.gov/air-emissions-modeling/2016v1-platform.
Population data is available at: www2.census.gov/programs-surveys/acs/summary_file/2018/data/.
Mortality data is available at: https://wonder.cdc.gov/cmf-icd10.html.
Morbidity data is available at: www.epa.gov/benmap/benmap-community-edition.
All data that support the findings of this study are included within the article (and any supplementary information files).
Author contributions
JB—Research conceptualization, health analyses, results interpretation, lead writing, funding acquisition
SR—Atmospheric modeling, results interpretation, writing
DY—Emissions inventory preparation
CC—Emissions inventory preparation
AR—Research conceptualization, writing, results interpretation
TT—Research conceptualization, results interpretation
DL—Research conceptualization, emissions inventory preparation
RM—Research conceptualization, emissions inventory preparation
DM—Research conceptualization, results interpretation
SA—Research conceptualization, atmospheric modeling, results interpretation, writing, funding acquisition.
Code availability
CMAQ v5.2.1 source code is available at: https://github.com/USEPA/CMAQ/blob/5.2.1/CCTM/docs/Release_Notes/README.md
Core BenMAPR Code is available at: https://github.com/jjbuonocore/BenMAPR.
Conflict of interest
The authors declare no competing interests.
Supplementary data (1.9 MB PDF)